The stock market recently recorded its 24th record high this year.
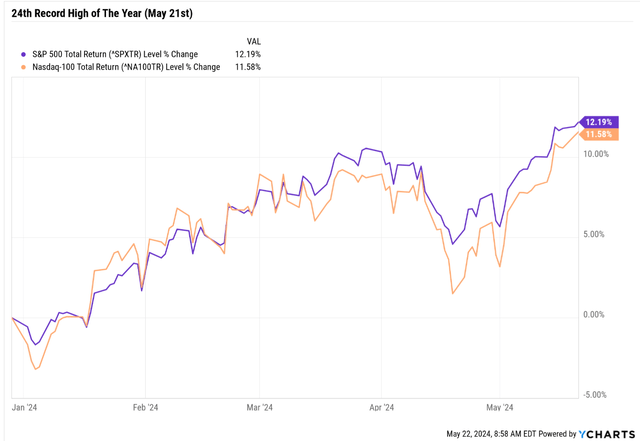
Ycharts
Naturally, many investors are worried about buying at record highs, thinking stocks are overvalued.
Buying Stocks At Record Highs Is A Smart Long-Term Choice
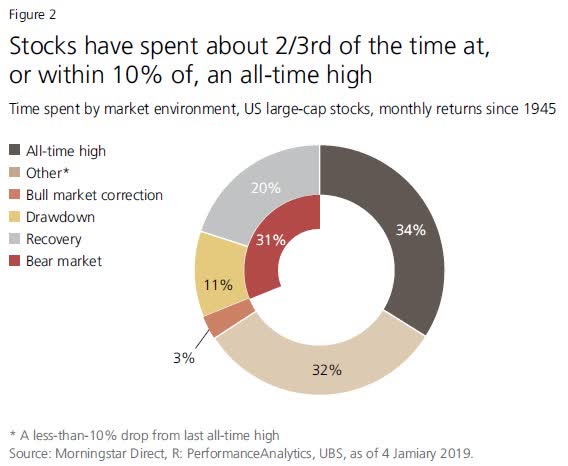
UBS
Stocks have spent a lot of time at record highs.
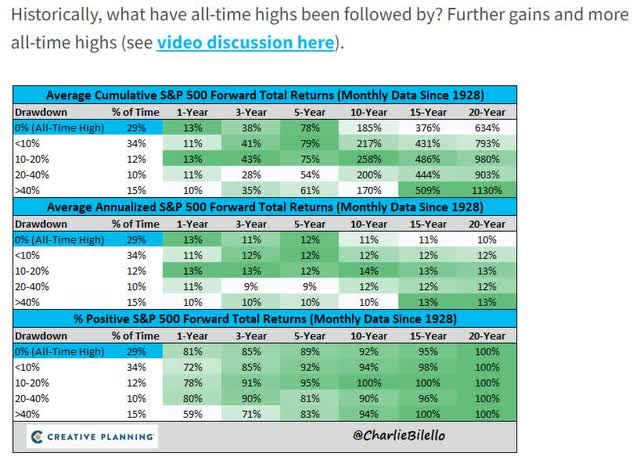
Charlie Bilello
Buying at record highs doesn’t historically mean lower returns. In fact, in the short term, it means higher returns are statistically more likely.
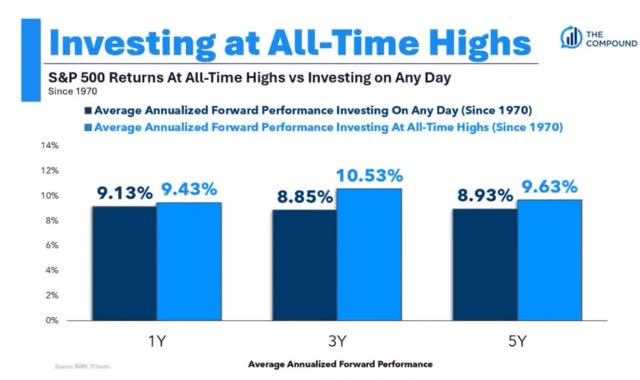
Ritholtz Wealth Management
If stocks are at record highs 33% of the time since World War II and stocks go up about 10% per year, doesn’t it make sense that buying at record highs would give you historical returns?
Not to mention that momentum is a real alpha factor, and bull markets tend to be backed by solid economies and good earnings growth.
What about valuations? Aren’t stocks in a bubble? Nope.
Valuations Matter… But Stocks Aren’t Necessarily Overvalued
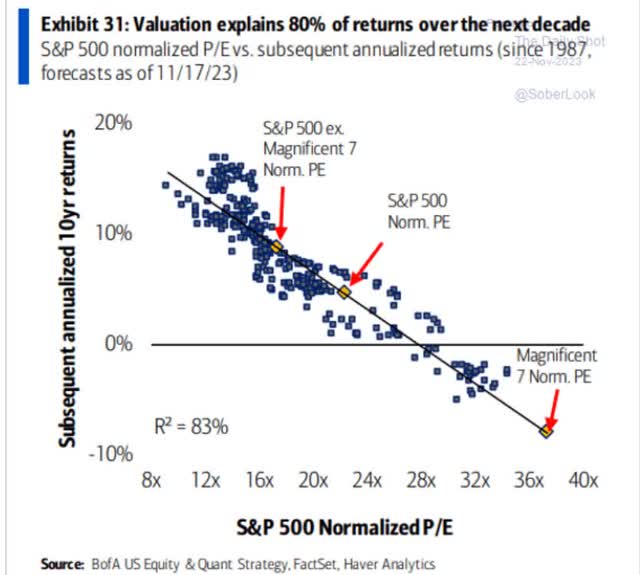
Bank of America
Valuations certainly matter, explaining 80% to 90% of returns over the next decade. However, the valuation metric you use matters.
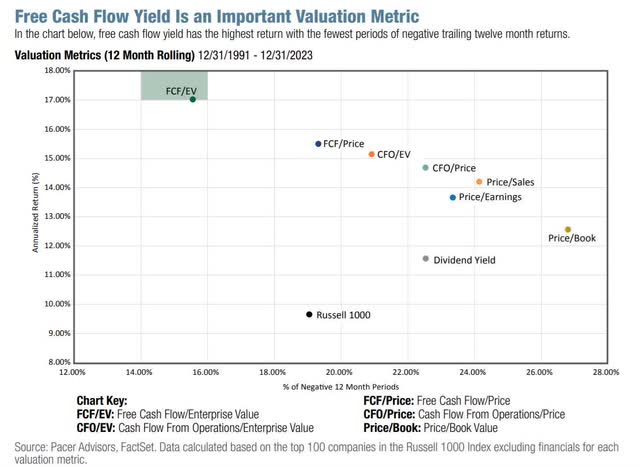
Pacer Funds
Enterprise value or EV is market cap + net debt (debt minus cash).
This is the cost of buying the entire company.
EV/cash flow is the most accurate valuation metric, whether EBITDA (a private equity favorite valuation), operating cash flow, or free cash flow (the best valuation metric of the last 33 years).
These are “cash-adjusted” valuations, which are what institutions and investing professionals think about valuations. Here’s why:
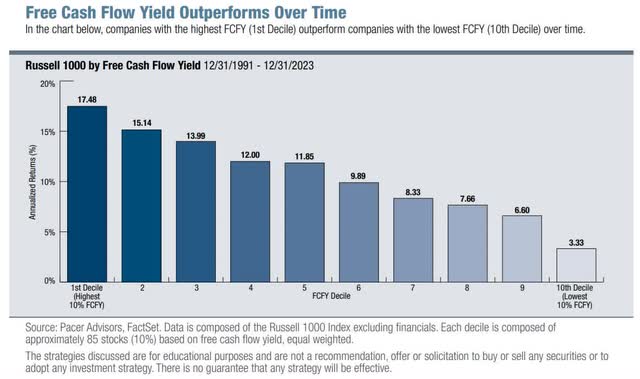
Pacer Funds
Why Cash-Adjusted Valuations Matter
Imagine a company with a $1 trillion market cap but $500 billion in cash and no debt. It trades at a PE of 30 and is growing at 15%.
That’s a price/earnings/growth or PEG ratio of 2. You might think this company is overvalued.
However, its EV/earnings (and cash flows) are 50% lower, or a cash-adjusted PE of 15, and a cash-adjusted PEG of just 1.0.
That’s Peter Lynch’s growth at a reasonable price or GARP.
So, buying this hypothetical company is a potentially reasonable decision, not a speculative one, like the one the PE alone might have you believe.
And what if the historical cash-adjusted PEG ratio is 2? And it’s now 1? The company is now potentially 50% undervalued, adjusted for growth and cash on the balance sheet.
It’s now potentially an ultra-value Buffett-style “fat pitch.”
One that could double to return to historical fair value.
Over five years, this company could, if it grows as expected and returns to fair value, deliver 100% upside (to return to fair value) and 15% growth (100% EPS growth) or 200%, 25% annual total returns.
Now imagine this stock yields 5%. The total return potential is 30% annually or 271% over the next five years.
Yet, if you only look at the PE and PEG ratios, you might think you should avoid this company or even short it!
So, what is the S&P’s actual cash-adjusted valuation?
S&P 500 Cash-Adjusted Valuation Profile
| Week | 21 | |
| % Of Year Done | 2024 Weighting | 2025 Weighting |
| 40.38% | 59.62% | 40.38% |
| Forward S&P EV/EBITDA (Cash-Adjusted Earnings) | 10-Year Average | Market Overvaluation |
| 14.24 | 13.47 | 5.72% |
| S&P Fair Value | Decline To Fair Value | Cash-Adjusted Fair Value PE |
| 5,033.53 | 5.41% | 19.71 |
(Source: Dividend Kings S&P 500 Valuation Tool)
The S&P trades at a 6% historical premium to its 10-year cash-adjusted PE.
But what about growth? As Peter Lynch taught us, all savvy investors pursue growth at a reasonable price.
What is the S&P’s 10-year EPS growth rate? According to FactSet Research, 7.61%.
So that’s a cash-adjusted PEG of 1.77. Remember that fundamentals explain 80% to 90% of stock returns over 10 years, according to Bank of America and JPMorgan.
So, over the last decade, billions of cumulative global investors have, in the words of Ben Graham, “weighed the substance of the US market” and concluded that 1.77 cash-adjusted PEG is an objective fair value.
What’s the current S&P EPS growth rate? 12%.
That means a cash-adjusted PEG ratio of 1.22 vs 1.77 10-year average.
| Potential Overvaluation | S&P 10-Year Average Cash-Adjusted PEG | S&P Current Cash-Adjusted PEG |
| -31.24% | 1.77 | 1.22 |
(Source: Dividend Kings S&P 500 Valuation Tool)
The 25-year average cash-adjusted PEG is 2.2, so it’s been trending lower over time as growth rates accelerate.
But you can see that it’s possible to argue with pure fundamentals and from the perspective of long-term objective market-determined fair value that stocks might be undervalued today.
Or, at the very least, less than 14X cash-adjusted earnings for wide-moat US companies growing at 12% is Peter Lynch’s growth at a reasonable price.
Dividend Aristocrats: Superior Quality At A Better Valuation
I track 500 companies, including all 130 dividend champions, aristocrats, and kings.
- Dividend Aristocrat: S&P companies with 25+ year dividend growth streaks.
- Dividend Champions: Any company or LP (including MLPs), including foreign ones, with a 25-plus year dividend growth streak.
- Dividend Kings: Any company, LP, or MLP with a 50+ year dividend growth streak.
Here’s what’s amazing for those who love the dependability and quality of the Dividend aristocrats.
Dividend Aristocrats (Champions) Fundamentals

DK Zen Research Terminal

Dividend Kings Zen Research Terminal
The aristocrats have a 2.7% average yield with a 5% historical discount, compared to the S&P’s 1.5% yield and 6% historical premium.
The growth rate is slower at 8% vs 12% (though S&P’s historical growth rate is 6% to 7%), and the credit rating is BBB+ stable (4.2% 30-year bankruptcy risk).
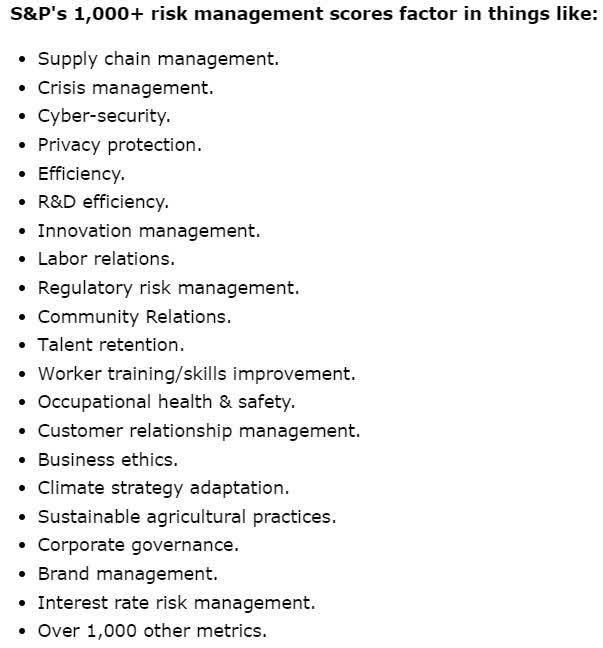
S&P rates them among the top 34% of world companies regarding long-term risk management. What does that mean? Everything can go wrong with a business.
S&P
Why should investors care about risk metrics like these?
Wide Moat Research
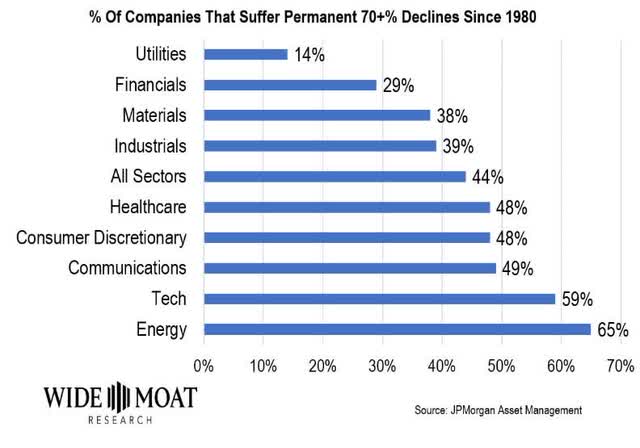
Most US companies don’t perform well over time, and 44% suffer what JPMorgan calls “permanent catastrophic declines” of 70% or more.
They fall 70% or more from record highs and never, ever record, or at least not since 1980.
S&P has been incorporating its long-term risk management ratings, perfecting for over 20 years, into its credit ratings. Every credit rating you’ve ever seen for a quarter century has included these ratings.
But here’s what’s impressive for those seeking to maximize total returns.
S&P’s analysis found that companies with higher risk-management scores have higher valuations and profitability. A 10-point increase in risk-management score was associated with a 1.2x higher EV/EBITDA multiple and 1.8x higher profitability.
A meta-study by NYU Stern School of Business found that 58% of studies on corporate metrics from 2015 to 2020 showed a positive relationship between risk management performance and financial performance metrics like ROE and stock price.
Think of it this way. You don’t become a dividend aristocrat with an average dividend growth streak of 43 years without having excellent risk management baked into the DNA of your corporate culture.
Risk management is why we pay executives millions of dollars to oversee the more than 1,000 things (in 61 subcategories) that can go wrong with a business.
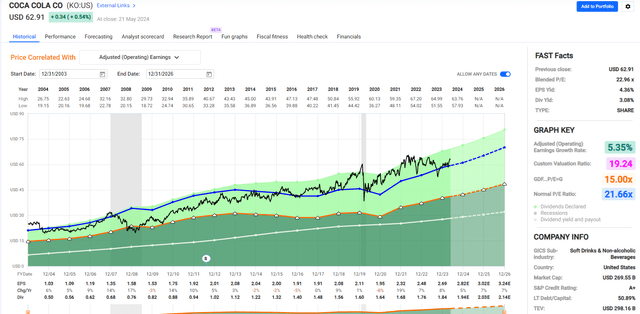
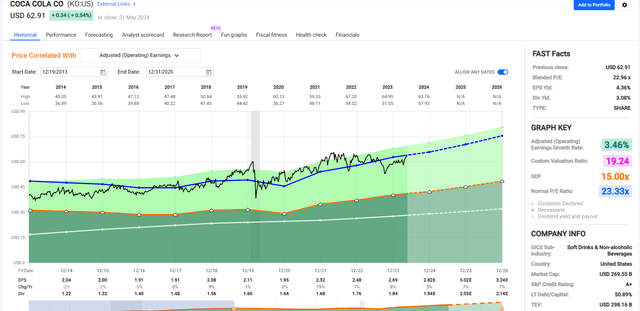
The average EV/FCF ratio is 25, which seems alarmingly high, but the 10-year average is 26.3. Isn’t that very high? For companies that grow at 8%? That’s a PEG of 3.3!
20-year PEG On KO is 4.05
FAST Graphs, FactSet
10-year PEG On KO is 6.78
FAST Graphs, FactSet
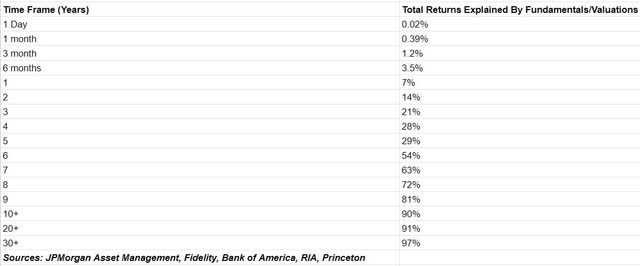
According to studies by JPMorgan, Bank of America, Princeton, RIA, and Fidelity, the market is almost always (80% to 97%) right over 10-plus-year periods.
Dividend Kings S&P 500 Valuation Tool
In other words, were KO trading at 23X earnings for a few months? That might be overvalued. If it trades that long for 10 years, there’s an 80% to 90% probability that this is the market-determined fair value.
The market is “correctly weighing the company’s substance,” as Ben Graham would say.
Valuation is like technical analysis, just over the very long term, 10+ years, where the statistical significance of data is 90% to 97%.
In the short term, luck is 13X as powerful as fundamentals; in the long term, fundamentals are 33X as powerful as luck.
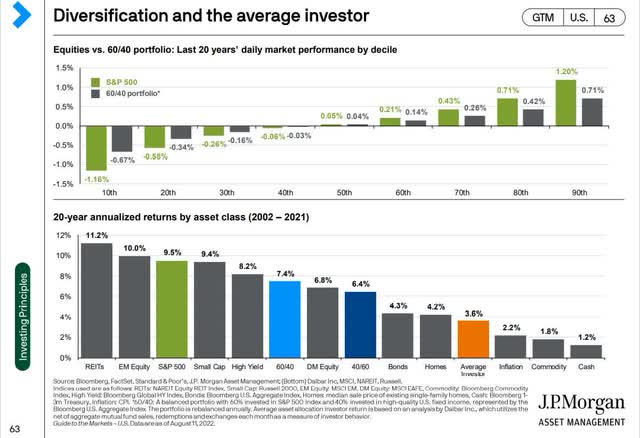
If The “Pros” Can’t Time The Market, Individual Investors Shouldn’t Even Try
JPMorgan Asset Management
With my work, there’s no technical analysis or timing, just “fundamental technical analysis,” using the best available consensus data to determine safety and quality and market-determined objective long-term fair value to determine whether to buy or not to buy… or sell.
100% Rules-Based Investing Recommendations

DK Research Terminal
So now let me share with you why I use 50% as the cutoff for our “potential trim/sell” recommendations.
The Dangers Of 50% Overvalued Companies
JPMorgan Asset Management
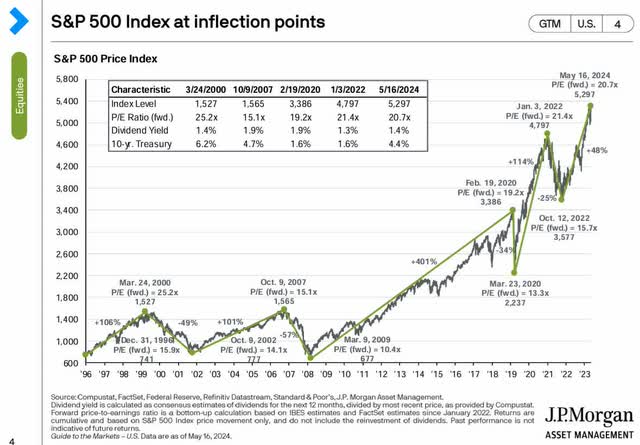
The S&P’s peak valuation was in March 2000, with 25.2X forward earnings and a 50% historical premium.
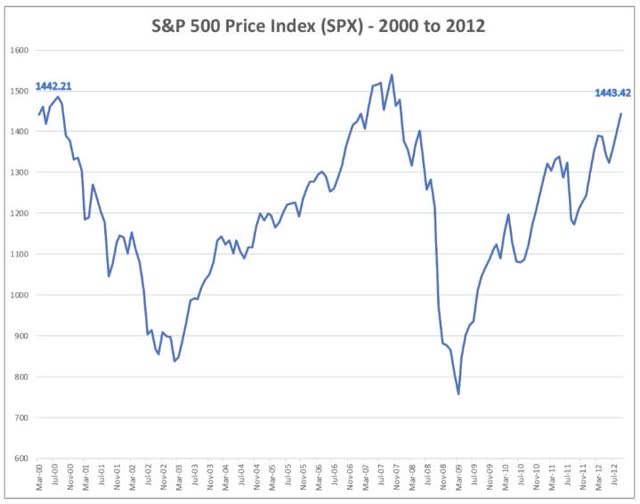
That’s as overvalued as the S&P, resulting in a loss of 12 years for the S&P.
Investing Par Excellence
Including inflation, S&P investors buying at an all-time high valuation took 15 years to break even.
Does that mean that buying and holding the S&P is a bad idea? 15 lost years!
Or does this prove that buying the world’s best companies at a 50% premium is speculative, reckless, and just asking for trouble?
You’re asking for trouble and disappointing returns if you buy even God’s company at a 50% premium.
That applies even more to individual companies.
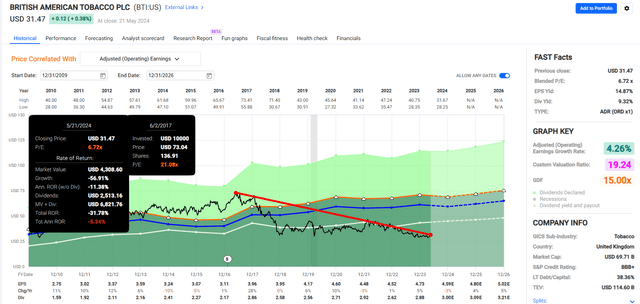
British American (BTI) Bubble Peak: 50% Overvalued
FAST Graphs, FactSet
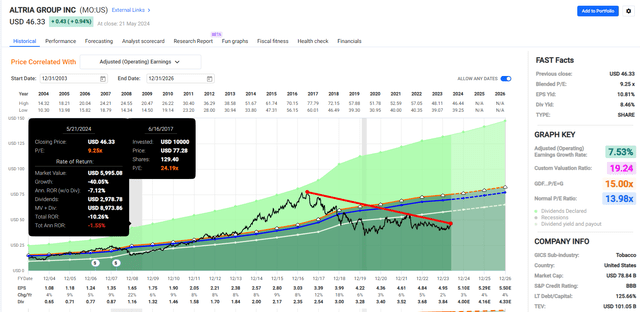
Altria (MO) Bubble Peak: 75% Overvalued
FAST Graphs, FactSet
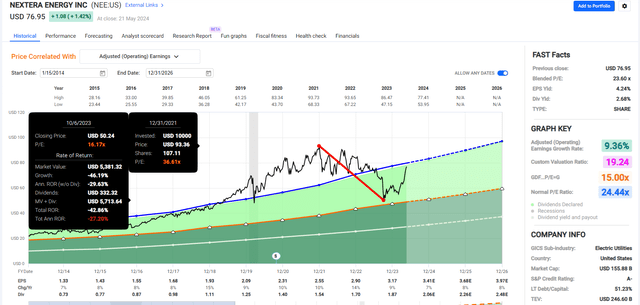
NextEra Energy (NEE) Bubble Peak: 55% Overvalued
FAST Graphs, FactSet
Tesla Bubble Peak: 282% Overvalued
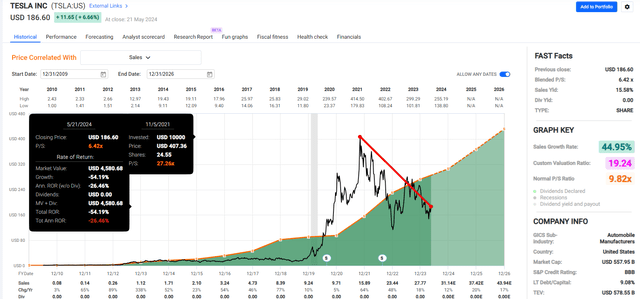
FAST Graphs, FactSet
And that’s an example of a bubble company that has kept growing steadily or as expected.
3M Bubble Peak: 56% Overvalued
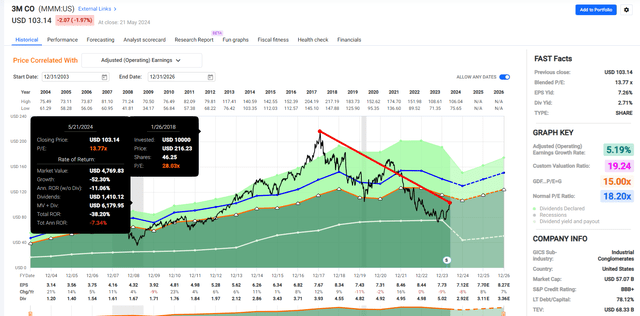
FAST Graphs, FactSet
Why is paying more than a 50% historical premium so challenging? I can’t think of any examples in market history where investors bought at such a lofty premium and didn’t suffer a significant bear market relatively soon afterward.
A 50% premium or more is priced for nothing ever going wrong again.

Brent Beshore
The 5 Most Overvalued Dividend Aristocrats To Sell Now
The dividend aristocrats as a group are 5% undervalued and have a 12% fundamentally justified upside within the next year (this is not a forecast, just what would be justified by fundamentals as we know them today).
The average five-year consensus total return potential is 11% yearly or 66% over the next five years.
But guess what? Some aristocrats are incredibly overvalued.
| Dividend Kings Zen Research Terminal Screening Criteria | Companies Remaining | % Of Master List | |
| 1 |
Add “12-month fundamentally justified upside, 5-year total return potential, and dividend growth streaks” Under “Columns.” |
0.00% | |
| 2 | Under “list” Dividend Champions | 130 | 25.90% |
| 3 | Rank by valuation, worst to best | 138 | 27.49% |
| 4 | Isolate five most overvalued aristocrats (-39% or more overvalued) under “valuation” tab. | 5 | 1.00% |
| Time | 1 Minute |
By screening the dividend champions by valuation, worst to best, and then isolating the five most overvalued, 39% or more historically overvalued, we can find the five most overvalued aristocrats to avoid. It would be best to consider trimming or selling them, and here’s why.
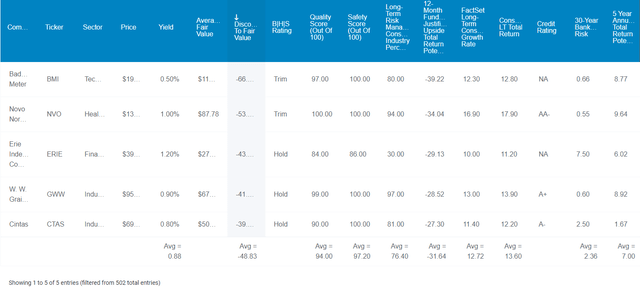
Dividend Kings Zen Research Terminal
There’s nothing wrong with the quality of companies like Badger Meter (BMI). These aristocrats have impeccable 94% quality and 97% dividend safety.
They have a 0.5% risk of a dividend cut right now and even in another Great Recession, just 2%.
S&P rates them A- stable, with a 2.36% 30-year bankruptcy risk and 76th percentile global risk management, 10% better than the aristocrats in general.
That historically means a 20% premium in valuation would be justified, but they’re 49% historically overvalued, a bubble aristocrat bucket just waiting for a significant correction.
Their 12-month fundamentally justified consensus total return potential is -32%.
If these five aristocrats fall by a third in the next year, despite growing earnings by an expected 14%, that would be 100% justified by today’s fundamentals as best as we know them.
Even though their earnings are expected to grow almost 100% in the next five years, the consensus five-year total return potential is 7% or 40%, including 0.9% yielding dividends.
50% of the gains in earnings are expected to be eaten up by valuation mean reversion.
2026 Consensus Total Return Potential For The 5 Highest Risk
Consensus 2026 Total Return Potential
- It’s not a forecast.
- Consensus return potential.
- These are the expected returns if and only if these companies grow as expected and return to historical fair value by the end of 2026.
- Fundamentals would justify that.
Most Overvalued Aristocrats Average: -20% = -7% annually vs 40% or 12% annually S&P.
1-Year Fundamentally Justified Upside Potential: -32% vs 8% S&P.
By the end of 2026, this group of five companies has a consensus total return potential of -20%. Imagine losing 20% of your investment, not counting inflation, over the next 2.5 years while the S&P rises a fundamentally justified 40%.
Badger Meter (BMI) Pricing In The Next 4 Years Worth Of Consensus Growth
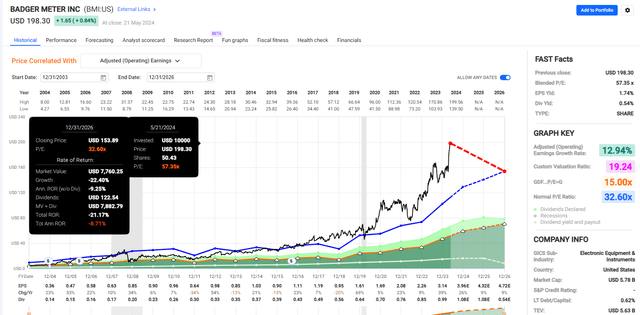
FAST Graphs, FactSet
Novo Nordisk (NVO) Pricing In 4 Years Of Consensus Growth
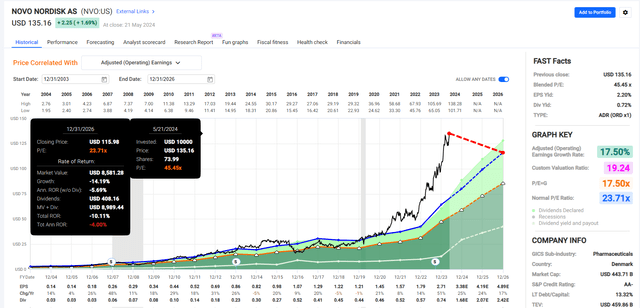
FAST Graphs, FactSet
Erie Indemnity (ERIE) Pricing In 4 Years Of Consensus Growth
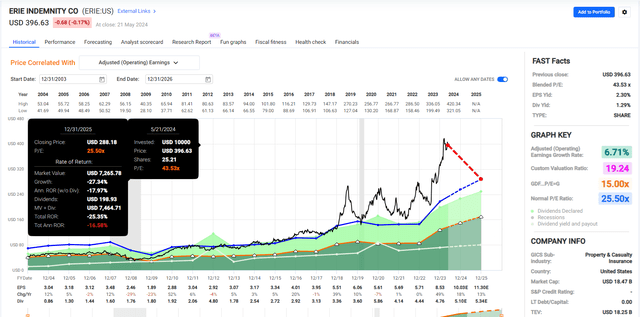
FAST Graphs, FactSet
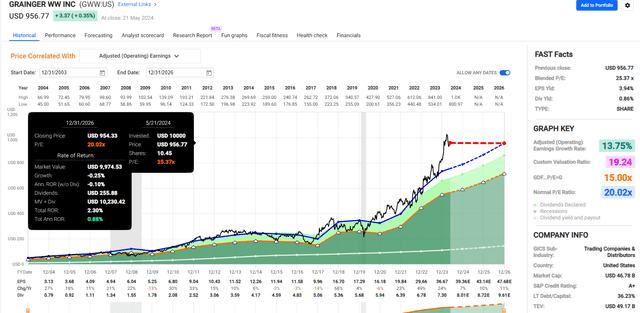
W. W. Grainger (GWW) Pricing In 3 Years of Consensus Growth
FAST Graphs, FactSet
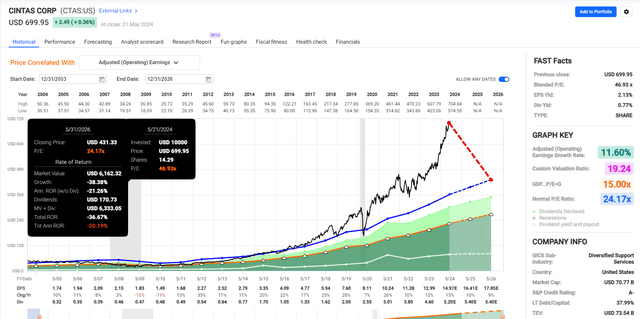
Cintas (CTAS) Pricing In 5 Years Of Consensus Growth
FAST Graphs, FactSet
Risks To Consider
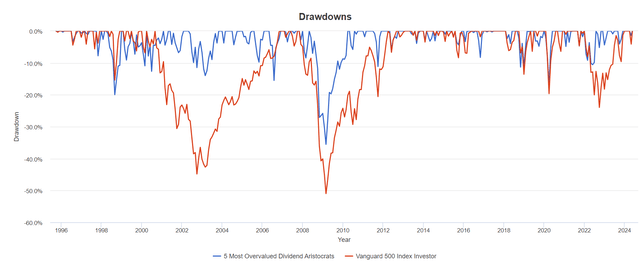
It’s important to remember that while corrections from 50% overvaluations are almost always what happens, it’s not a guarantee.
Portfolio Visualizer

Portfolio Visualizer

Portfolio Visualizer
A 50% crash? Nope, not justified. A 32% decline in the next year would bring these aristocrats back to fair value.
And note how, within five years, analysts do expect investors in all five companies, equally weighted, to be up 40% potentially. Adjusted for inflation, that’s about a 25% gain or 5% annually, but not exactly great returns.
But have you owned these companies for decades? If you’re sitting on huge capital gains? Then, it might not be worth trimming and paying the taxes.
165X Return Since 1995

Portfolio Visualizer
Some companies could trade sideways for several years while their premiums wear off.
Remember how 93% of stock returns in the short term are explained by momentum and luck? Well, that’s why you can’t time bubble tops or crashes.
Tesla became 50% overvalued, then 100%, then 150%, then 200%, then 250%, and then 283%, and finally crashed.

Portfolio Visualizer
The five-year consensus return potential of 7% is twice the 3.3% worst five-year rolling return.
Bottom Line: The 5 Most Overvalued Dividend Aristocrats To Consider Selling Now
I’m not saying that Badger Meter and the rest of the most overvalued aristocrats are doomed to a crash. I’m saying that the probabilities of great returns from here are very small, given that all of them are pricing in 3 to 5 years of consensus growth.
When a company is priced for perfection, as if nothing will ever go wrong again, it’s like tempting fate.
Remember how 3M was 56% overvalued in 2018 at the peak of its bubble? Infrastructure spending! That was the red-hot story. It was a dividend king with a 58-year dividend growth streak, an A-credit rating, and risk management in the top 5% of companies worldwide.
Then, new management got hit with a trade war and a pandemic, disrupting the supply chain. The turnaround failed and kept failing, and the company was hit with a wave of lawsuits about earplugs and PFAS from several states.
Finally, the venerable 64-year dividend growth streak ended with a spin-off linked to the payout’s slashing.
No, 3M’s 28 PE in 2018 didn’t cause these things. They would happen regardless of whether 3M was 50% overvalued or 50% undervalued.
But if 3M had been 50% undervalued? If it had been trading at 9X earnings instead of 28X? Then, look at what would have been the result.
-7% total return since 2018 peak – 6.6% average yield on cost = -0.4% total return. That’s a 3% decline instead of 38%.
Yes, 3M investors would still have lost money over six years, especially adjusted for inflation.
But compared to the 40% non-inflation-adjusted total return over six years, a margin of safety is valuable.
Buy a company at its market-determined historical fair value, and you participate fully in its future, yield, and long-term growth.
Knowingly overpaying can lead to increased risk because something will always go wrong with even the best companies in the future.
Read the full article here