Earnings of Home Bancshares, Inc. (Conway, AR) (NYSE:HOMB) will most probably remain stable through the end of 2024. Subdued loan growth and slight margin expansion will likely support earnings, while a normal growth in expenses will restrict earnings. Overall, I’m expecting Home Bancshares to report earnings of $2.03 per share for 2023 and $2.04 per share for 2024. The year-end target price suggests a high upside from the current market price. Hence, I’m maintaining a buy rating on Home Bancshares.
Loan Trend Likely to be Better in the Second Half Compared to the First Half of the Year
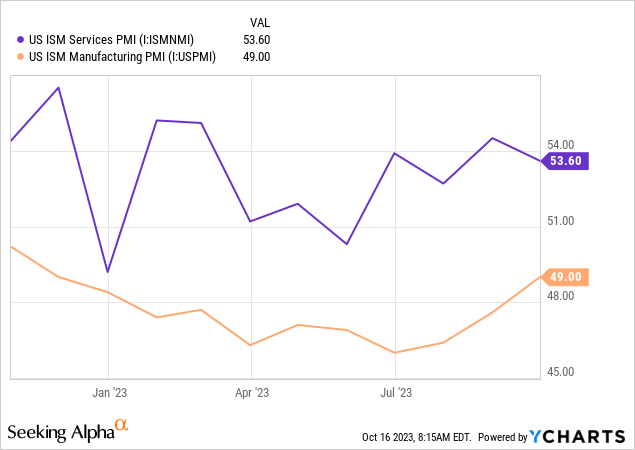
Home Bancshares’ performance was quite disappointing during the first half of the year because of material balance sheet shrinkage. Deposits decreased by 5.3% while loans declined by 1.6% during the first half. I’m not expecting a further decline because of a recent turnaround in business activity. Though the manufacturing PMI index is still in the contractionary territory (i.e. below 50), it is now much higher than in previous months. Similarly, the PMI services index is indicating better activity than the second quarter of this year.
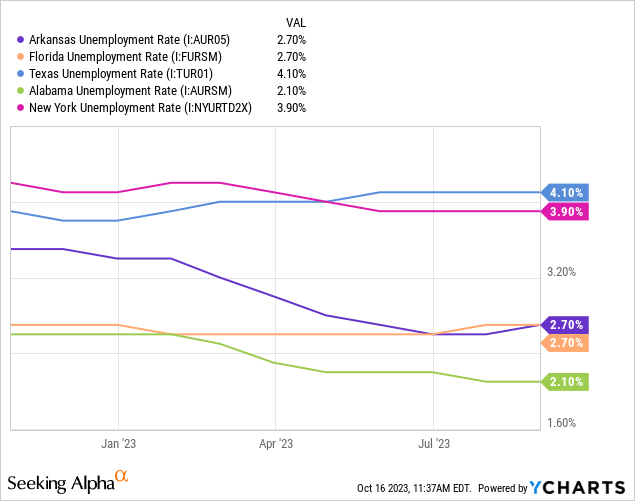
Home Bancshares’ loans are concentrated in Arkansas, Florida, Texas, Alabama, and New York. The unemployment rates of Alabama, Arkansas, and New York are currently lower than before, while the unemployment rates of Texas and Florida are higher than before. Therefore, the labor markets are presenting a mixed near-term outlook for economic activity, and consequently loan growth.
Considering these factors, I’m expecting the loan portfolio to grow by 0.5% each quarter through the end of 2024. The following table shows my balance sheet estimates.
| Financial Position | FY18 | FY19 | FY20 | FY21 | FY22 | FY23E | FY24E |
| Net Loans | 10,963 | 10,768 | 10,975 | 9,599 | 14,120 | 14,035 | 14,317 |
| Growth of Net Loans | 7.3% | (1.8)% | 1.9% | (12.5)% | 47.1% | (0.6)% | 2.0% |
| Other Earning Assets | 2,462 | 2,406 | 3,495 | 6,650 | 5,790 | 5,320 | 5,427 |
| Deposits | 10,900 | 11,278 | 12,726 | 14,261 | 17,939 | 17,167 | 17,513 |
| Borrowings and Sub-Debt | 1,985 | 1,140 | 939 | 912 | 1,222 | 1,315 | 1,342 |
| Common equity | 2,350 | 2,512 | 2,606 | 2,766 | 3,526 | 3,785 | 4,003 |
| Book Value Per Share ($) | 13.5 | 15.0 | 15.8 | 16.8 | 17.3 | 18.7 | 19.7 |
| Tangible BVPS ($) | 7.7 | 9.0 | 9.7 | 10.8 | 10.1 | 11.5 | 12.6 |
| Source: SEC Filings, Earnings Releases, Author’s Estimates (In USD million unless otherwise specified) | |||||||
Margin Likely to Rise Further Through Early Next Year
Home Bancshares averaged a net interest margin of 4.33% during the first half of this year, which is much higher than the average of 3.46% for the same period last year. This improvement was largely attributable to the rising interest-rate environment. The company’s net interest income is quite sensitive to interest-rate changes, as shown by the results of management’s rate-sensitivity analysis given in the 10-Q filing.
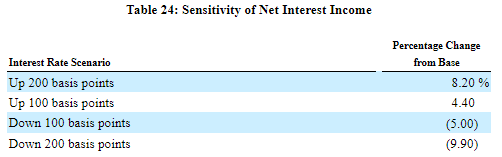
2Q 2023 10-Q Filing
Although I’m expecting no change in the Fed Funds rate in the remainder of the year, I believe the margin can continue to remain northbound for the remainder of this year and early next year because of the lagged effect of recent rate hikes. Further, treasury yields are currently much higher than in previous periods (compare dark blue line below with other lines).
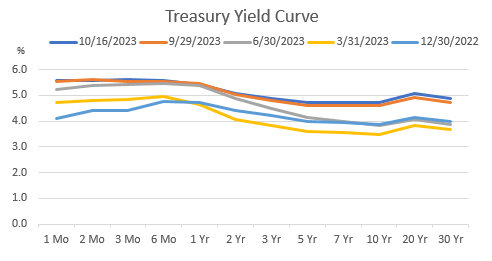
The U.S. Treasury Department
However, deposit costs can act as a damper. The company’s deposit mix has steadily worsened over the up-rate cycle. Non-interest-bearing deposits dropped to 27.1% of total deposits by the end of June 2023 from 30.8% of total deposits at the same time last year. As a result, deposit costs likely surged at a higher rate in the third quarter compared to the first and second quarters.
However, management mentioned in the conference call that its peer banks may not price deposits as aggressively in the second half of 2023 as in the first half of the year. Therefore, there is a chance that pressure on deposit costs may ease.
Considering these factors, I’m expecting the margin to have increased by five basis points in the third quarter of the year. Further, I’m expecting the margin to grow by five basis points each quarter till the middle of 2024.
Expecting Earnings to Remain Stable
I’m expecting earnings in the second half of 2023 to be quite close to the earnings for the first half of the year. Loan growth and an increase in the margin will likely counter the pressure from provisioning and non-interest expense growth. I’m expecting provisioning growth to be normal, and the growth of non-interest expense to be dependent on inflation.
Home Bancshares is scheduled to release its third-quarter results on Thursday, October 19, 2023. I’m expecting the company to report earnings of $0.50 per share, which is slightly below the earnings of $0.52 per share reported for the second quarter of the year. For 2024, I’m expecting earnings to be almost unchanged from this year’s expected level. The following table shows my annual income statement projections.
| Income Statement | FY18 | FY19 | FY20 | FY21 | FY22 | FY23E | FY24E |
| Net interest income | 561 | 563 | 583 | 573 | 759 | 842 | 874 |
| Provision for loan losses | 4 | 1 | 112 | (5) | 64 | 25 | 36 |
| Non-interest income | 103 | 100 | 112 | 138 | 175 | 183 | 203 |
| Non-interest expense | 264 | 276 | 304 | 299 | 476 | 465 | 503 |
| Net income – Common Sh. | 300 | 290 | 214 | 319 | 305 | 412 | 414 |
| EPS – Diluted ($) | 1.73 | 1.73 | 1.30 | 1.94 | 1.57 | 2.03 | 2.04 |
| Source: SEC Filings, Earnings Releases, Author’s Estimates (In USD million unless otherwise specified) | |||||||
In my last report, which was issued before the first quarter’s results, I estimated earnings of $2.01 for 2023. My updated earnings estimate hasn’t changed much as the company’s earnings reported so far haven’t surprised me. Further, my outlook hasn’t changed much.
Risks Appear Subdued
Home Bancshares’ riskiness has significantly eased as uninsured deposits were down to 29.0% of total deposits by the end of June 2023 from 50.5% at the end of December 2022 (as mentioned in the second quarter’s 10-Q filing and last year’s 10-K filing).
Further, unrealized losses on the Available-for-Sale securities portfolio were around 11% of the equity book value balance at the end of June 2023, slightly better than 12% at the end of December 2022.
The loan portfolio also has manageable credit risk. Non-accrual loans were just 0.35% of total loans at the end of June 2023. Overall, I believe Home Bancshares’ risk level is currently low.
Maintaining a Buy Rating
Home Bancshares is offering a dividend yield of 3.4% at the current quarterly dividend rate of $0.18 per share. The earnings and dividend estimates suggest a payout ratio of 35% for both 2023 and 2024, which is in line with the five-year average of 34%. Therefore, I’m not expecting any change in the dividend level.
I’m using the historical price-to-tangible book (“P/TB”) and price-to-earnings (“P/E”) multiples to value Home Bancshares. The stock has traded at an average P/TB ratio of 2.24 in the past, as shown below.
| FY18 | FY19 | FY20 | FY21 | FY22 | Average | |
| T. Book Value per Share ($) | 7.7 | 9.0 | 9.7 | 10.8 | 10.1 | |
| Average Market Price ($) | 22.3 | 18.7 | 16.4 | 24.5 | 23.2 | |
| Historical P/TB | 2.89x | 2.07x | 1.69x | 2.27x | 2.29x | 2.24x |
| Source: Company Financials, Yahoo Finance, Author’s Estimates | ||||||
Multiplying the average P/TB multiple with the forecast tangible book value per share of $11.50 gives a target price of $25.80 for the end of 2023. This price target implies a 20.8% upside from the October 16 closing price. The following table shows the sensitivity of the target price to the P/TB ratio.
| P/TB Multiple | 2.04x | 2.14x | 2.24x | 2.34x | 2.44x |
| TBVPS – Dec 2023 ($) | 11.5 | 11.5 | 11.5 | 11.5 | 11.5 |
| Target Price ($) | 23.5 | 24.6 | 25.8 | 26.9 | 28.1 |
| Market Price ($) | 21.3 | 21.3 | 21.3 | 21.3 | 21.3 |
| Upside/(Downside) | 10.0% | 15.4% | 20.8% | 26.1% | 31.5% |
| Source: Author’s Estimates |
The stock has traded at an average P/E ratio of around 12.8x in the past, as shown below.
| FY18 | FY19 | FY20 | FY21 | FY22 | Average | |
| Earnings per Share ($) | 1.73 | 1.73 | 1.30 | 1.94 | 1.57 | |
| Average Market Price ($) | 22.3 | 18.7 | 16.4 | 24.5 | 23.2 | |
| Historical P/E | 13.0x | 10.8x | 12.6x | 12.6x | 14.8x | 12.8x |
| Source: Company Financials, Yahoo Finance, Author’s Estimates | ||||||
Multiplying the average P/E multiple with the forecast earnings per share of $2.03 gives a target price of $25.90 for the end of 2023. This price target implies a 21.5% upside from the October 16 closing price. The following table shows the sensitivity of the target price to the P/E ratio.
| P/E Multiple | 10.8x | 11.8x | 12.8x | 13.8x | 14.8x |
| EPS – 2023 ($) | 2.03 | 2.03 | 2.03 | 2.03 | 2.03 |
| Target Price ($) | 21.9 | 23.9 | 25.9 | 28.0 | 30.0 |
| Market Price ($) | 21.3 | 21.3 | 21.3 | 21.3 | 21.3 |
| Upside/(Downside) | 2.5% | 12.0% | 21.5% | 31.0% | 40.5% |
| Source: Author’s Estimates |
Equally weighting the target prices from the two valuation methods gives a combined target price of $25.80, which implies a 21.1% upside from the current market price. Adding the forward dividend yield gives a total expected return of 24.5%. Hence, I’m maintaining a buy rating on Home Bancshares.
Read the full article here